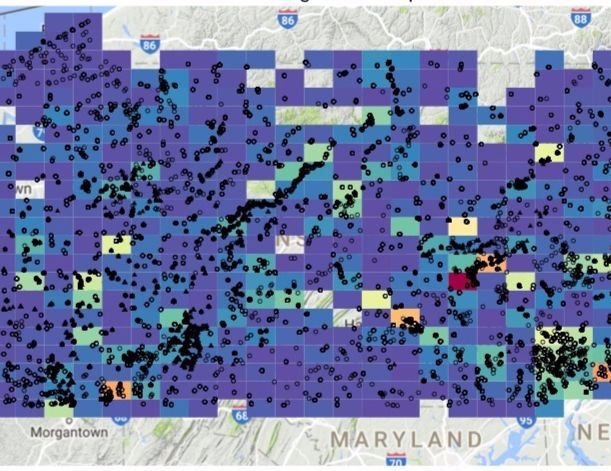
This app was designed to visualize the spatial distribution of observations using 2D histograms and kernel density estimation. Outliers are marked by yellow and the threshold can be changed starting from the inner fence (i.e. 3rd quartile +1.5*IQR).

This app was designed to visualize the spatial distribution of observations using 2D histograms and kernel density estimation. Outliers are marked by yellow and the threshold can be changed starting from the inner fence (i.e. 3rd quartile +1.5*IQR).